
Singapore · Tax policy
Singapore raises Land Betterment Charge rates for five of nine use groups from 1 September 2026
On 31 August 2026 the Singapore Land Authority published revised Land Betterment Charge rates for the half year from 1 September 2026 to 28 February 2027.
- Announced
- 31 August 2026
- In effect from
- 1 September 2026
- Authorities
- Singapore Land Authority, Urban Redevelopment Authority
Sign in to save this event to your research. It is free.
What changed, in brief
On 31 August 2026 the Singapore Land Authority published the Land Betterment Charge rates for the half year from 1 September 2026 to 28 February 2027. Five of the nine use groups rose on average: commercial 1.7%, landed residential 3.5%, non-landed residential 3.4%, industrial 3.9%, and places of worship and civic and community institutions 2.9%. Four did not move anywhere on the island. The largest single move was in sector 54, where the non-landed residential rate went from S$7,700 to S$9,940 per sq m of gross floor area, and sectors 55 and 56 rose from that same base to S$9,520. Boundaries were redrawn in four sectors. The rates reach a case by the date its Provisional Permission is granted, not by the date it is assessed or paid.
Key figures
View all 4 key figuresShow the first 3 key figures only
What you can do next
Current position: as introduced · 7 parameters, none amended
Original rule
as at 1 September 2026
Current position
as at 1 September 2026
Land Betterment Charge, non-landed residential, sector 54
S$9,940 per sq m of gross floor area
Land Betterment Charge, non-landed residential, sector 54
No amendment recorded in this archive
Land Betterment Charge, non-landed residential, sectors 55 and 56
S$9,520 per sq m of gross floor area
Land Betterment Charge, non-landed residential, sectors 55 and 56
No amendment recorded in this archive
Land Betterment Charge, commercial, sector 96
S$8,750 per sq m of gross floor area
Land Betterment Charge, commercial, sector 96
No amendment recorded in this archive
Land Betterment Charge, landed residential, sector 67
S$22,330 per sq m of gross floor area
Land Betterment Charge, landed residential, sector 67
No amendment recorded in this archive
Land Betterment Charge, commercial, sector 42
S$18,550 per sq m of gross floor area
Land Betterment Charge, commercial, sector 42
No amendment recorded in this archive
Land Betterment Charge, non-landed residential, sector 43
S$15,540 per sq m of gross floor area
Land Betterment Charge, non-landed residential, sector 43
No amendment recorded in this archive
Land Betterment Charge, industrial, sector 111
S$2,898 per sq m of gross floor area
Land Betterment Charge, industrial, sector 111
No amendment recorded in this archive
Explore
The change in detail, the market around it, what followed, and what Prevo makes of it.
What changed
The table, not the charge. The use groups, the assessment methods, the number of geographical sectors, the half-yearly cycle, the role of the Chief Valuer, the one-month payment period and the S$1,100 baseline processing fee are all as they were. What moved is the rate table, and the boundaries of sectors 7, 16, 23 and 35. Adding the per-group counts the release itself states gives 460 of the 1,062 cells: every sector in Use Groups D and E, 108 of 118 in B1, 70 in B2 and 46 in A. Four groups moved nowhere on the island, C, F, G and H, and that is worth stating because a frozen rate and an unrevised one look identical to a reader glancing at one sector.
| As recorded in the claim | Before | After | Change | Source |
|---|---|---|---|---|
| Sector 54 non-landed residential LBC rate, from S$7,700 per sq mS$ per sq m of gross floor area | 7,700 | 9,940 | +2,240 (+29.1%) | Claim 18 |
| In sectors 55 and 56, the Use Group B2 rate rose from S$7,700 to S$9,520 per square metre of gross floor area, from the same March 2026 base as sector 54.S$ per sq m of gross floor area | 7,700 | 9,520 | +1,820 (+23.6%) | Claim 19 |
| In sector 96, the Use Group A rate rose from S$7,350 to S$8,750 per square metre of gross floor area, the largest commercial increase in this revision.S$ per sq m of gross floor area | 7,350 | 8,750 | +1,400 (+19%) | Claim 20 |
| In sector 67, the Use Group B1 rate rose from S$20,650 to S$22,330 per square metre of gross floor area, which is both the largest landed residential increase and the highest landed residential rate in the table.S$ per sq m of gross floor area | 20,650 | 22,330 | +1,680 (+8.1%) | Claim 21 |
View all 7 before-and-after valuesHide the other 3
| In sector 43, the Use Group B2 rate rose from S$14,700 to S$15,540 per square metre of gross floor area, the highest non-landed residential rate in the table.S$ per sq m of gross floor area | 14,700 | 15,540 | +840 (+5.7%) | Claim 23 |
| In sector 111, the Use Group D rate rose from S$2,758 to S$2,898 per square metre of gross floor area, the highest industrial rate in the table.S$ per sq m of gross floor area | 2,758 | 2,898 | +140 (+5.1%) | Claim 24 |
| In sector 42, the Use Group A rate rose from S$17,850 to S$18,550 per square metre of gross floor area, the highest commercial rate in the table.S$ per sq m of gross floor area | 17,850 | 18,550 | +700 (+3.9%) | Claim 22 |
When it applies
- 31 August 2026Announced
- 1 September 2026In effect
Where it applies
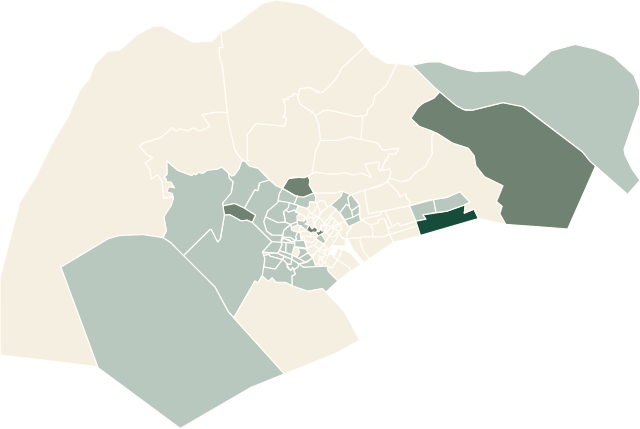
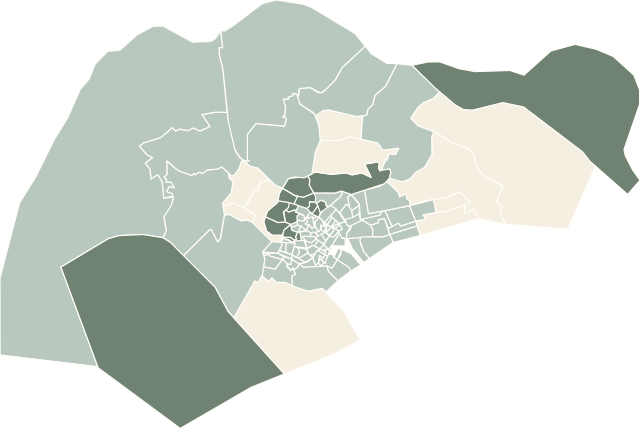
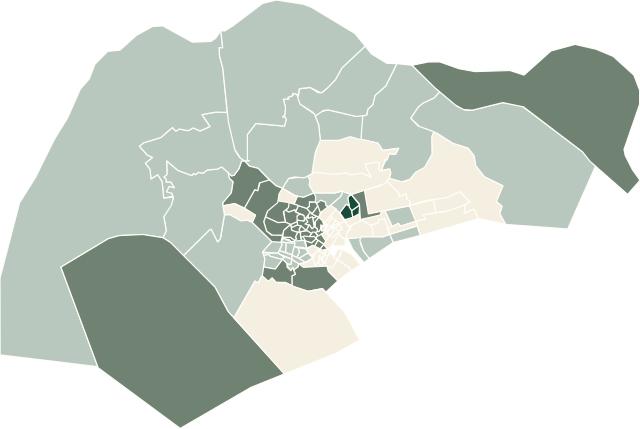
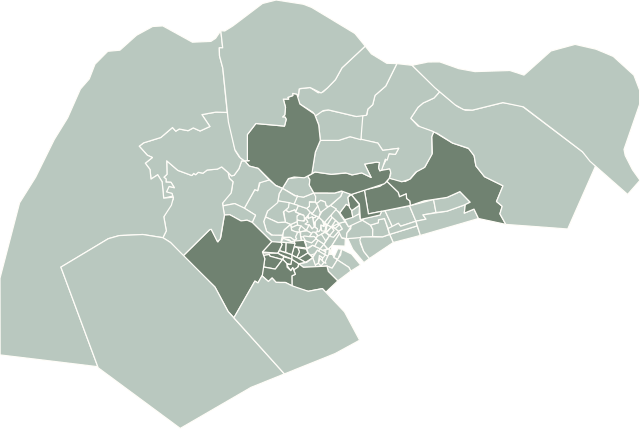
The rates are set sector by sector. Each map below is one use group, every one of the 118 sectors shaded by how far its rate moved from 1 March to 1 September 2026, as the map layer records both rates. The same figures are in the table under the maps. Hotel / hospital, Open space, Agriculture, Roads & infrastructure did not move in any sector.
Commercial
Rose in 46 of 118 sectors
Residential (landed)
Rose in 108 of 118 sectors
Residential (non-landed)
Rose in 70 of 118 sectors
Industrial
Rose in 118 of 118 sectors
Civic & community
Rose in 118 of 118 sectors
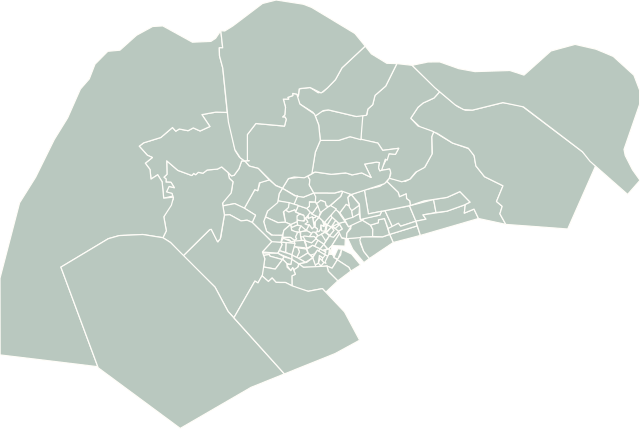
Sector-by-sector changes, as a table
| Sector | Commercial | Residential (landed) | Residential (non-landed) | Industrial | Civic & community |
|---|---|---|---|---|---|
| 1 | No change | +2.5% | No change | +2.3% | +2.7% |
| 2 | No change | +2.5% | No change | +2.3% | +2.7% |
| 3 | No change | +2.5% | No change | +2.3% | +2.7% |
| 4 | No change | +2.5% | No change | +2.3% | +2.7% |
| 5 | No change | +2.5% | No change | +2.3% | +2.7% |
| 6 | No change | +2.5% | No change | +2.3% | +2.7% |
| 7 | No change | +2.5% | No change | +2.3% | +2.7% |
| 8 | No change | +2.5% | No change | +2.3% | +2.7% |
| 9 | No change | +2.5% | No change | +2.3% | +2.7% |
| 10 | No change | +2.5% | No change | +2.3% | +2.7% |
| 11 | No change | +2.5% | No change | +2.3% | +2.7% |
| 12 | No change | +2.5% | No change | +2.3% | +2.7% |
| 13 | No change | +2.5% | No change | +2.3% | +2.7% |
| 14 | No change | +2.5% | No change | +2.3% | +2.7% |
| 15 | No change | +2.5% | No change | +2.3% | +2.7% |
| 16 | No change | +2.5% | No change | +2.3% | +2.7% |
| 17 | No change | +2.5% | No change | +2.3% | +2.7% |
| 18 | No change | +2.5% | No change | +2.3% | +2.7% |
| 19 | No change | +2.5% | +8.8% | +2.1% | +2.7% |
| 20 | No change | +2.5% | +6.1% | +2.1% | +2.7% |
| 21 | No change | +2.5% | +6.1% | +2.1% | +2.7% |
| 22 | +4.2% | +2.5% | +6.1% | +2.3% | +2.7% |
| 23 | +5.6% | +2.5% | +5.9% | +2.3% | +2.7% |
| 24 | No change | +2.5% | No change | +2.3% | +2.7% |
| 25 | No change | +4.2% | No change | +2.3% | +2.7% |
| 26 | No change | +4.2% | No change | +2.3% | +2.7% |
| 27 | No change | +4.2% | No change | +2.3% | +2.7% |
| 28 | No change | +4.2% | No change | +2.3% | +2.7% |
| 29 | No change | +4.2% | No change | +2.3% | +2.7% |
| 30 | No change | +4.2% | No change | +2.3% | +2.7% |
| 31 | No change | +4.2% | No change | +2.3% | +2.7% |
| 32 | No change | +4.2% | No change | +2.3% | +2.7% |
| 33 | No change | +4.2% | No change | +2.3% | +2.7% |
| 34 | No change | +1.8% | No change | +2.3% | +2.7% |
| 35 | No change | +1.8% | +6.1% | +2.3% | +2.7% |
| 36 | No change | +1.8% | +5.6% | +2.3% | +2.7% |
| 37 | No change | +1.8% | +5.7% | +2.3% | +2.7% |
| 38 | No change | +2.1% | +5.9% | +2.3% | +2.7% |
| 39 | No change | +2% | +6.1% | +2.3% | +2.7% |
| 40 | No change | +2.1% | +6.1% | +2.3% | +2.7% |
| 41 | +6.3% | +2.4% | +6.1% | +2.3% | +2.7% |
| 42 | +3.9% | +2.1% | +6.1% | +2.3% | +2.7% |
| 43 | +5% | +2.1% | +5.7% | +2.3% | +2.7% |
| 44 | No change | +2% | +6.1% | +2.3% | +2.7% |
| 45 | No change | +2.1% | +6.1% | +2.3% | +2.7% |
| 46 | No change | +1.9% | +8.7% | +2.3% | +2.7% |
| 47 | No change | +1.8% | +8.7% | +2.3% | +2.7% |
| 48 | No change | +1.9% | +8.7% | +2.1% | +2.7% |
| 49 | No change | +4.2% | +2.2% | +2.1% | +2.7% |
| 50 | No change | +4.2% | No change | +2.3% | +2.7% |
| 51 | No change | +4.1% | No change | +5% | +2.7% |
| 52 | +2.9% | +4.1% | No change | +5% | +2.7% |
| 53 | No change | +4.1% | No change | +5% | +2.7% |
| 54 | +3.8% | +4.1% | +29.1% | +5.1% | +2.7% |
| 55 | +3.8% | +4.1% | +23.6% | +5% | +2.7% |
| 56 | +3.8% | +4.1% | +23.6% | +5.1% | +2.7% |
| 57 | +3.8% | +3.9% | +2.9% | +5% | +2.7% |
| 58 | No change | +2% | No change | +5% | +2.7% |
| 59 | No change | +2% | +2.8% | +5% | +2.7% |
| 60 | No change | +5.1% | +6.1% | +2.3% | +2.7% |
| 61 | No change | +5.3% | +6.1% | +2.3% | +2.7% |
| 62 | No change | +7.8% | +5.6% | +2.3% | +2.7% |
| 63 | +3.4% | +7.9% | +6.1% | +2.3% | +2.7% |
| 64 | +6.4% | +7.9% | +3.4% | +2.3% | +2.7% |
| 65 | +2.9% | +7.8% | No change | +2.3% | +2.7% |
| 66 | +4.5% | +7.8% | +5.9% | +4.9% | +2.7% |
| 67 | +3.2% | +8.1% | +6.1% | +2.3% | +2.7% |
| 68 | +4.5% | +8.1% | +5.6% | +4.9% | +2.7% |
| 69 | +4.5% | +8.1% | +5.6% | +4.9% | +2.7% |
| 70 | +3.7% | +7.8% | +5.7% | +2.1% | +2.7% |
| 71 | +2.5% | +5.3% | +6.1% | +2.1% | +2.7% |
| 72 | +2.9% | +2.3% | +2.8% | +4.9% | +2.7% |
| 73 | +2.9% | +4.1% | +2.9% | +10.1% | +2.7% |
| 74 | +2.9% | +4.1% | +2.8% | +10.1% | +2.7% |
| 75 | +2.9% | +4.1% | +2.9% | +10.1% | +2.7% |
| 76 | +3.4% | +3.9% | No change | +2.1% | +2.7% |
| 77 | +2.9% | +3.9% | +6.4% | +10.1% | +2.7% |
| 78 | +2.9% | +3.9% | +2.8% | +10.1% | +2.7% |
| 79 | +2.9% | +4.1% | +2.9% | +10.1% | +2.7% |
| 80 | No change | +3.9% | +2.8% | +10.1% | +2.7% |
| 81 | +2.9% | +4.1% | +2.9% | +10.1% | +2.7% |
| 82 | +2.9% | +3.9% | +2.8% | +10.1% | +2.7% |
| 83 | +2.9% | +3.9% | +2.8% | +10.1% | +2.7% |
| 84 | +2.9% | +4.1% | +2.9% | +10.1% | +2.7% |
| 85 | +2.9% | +3.9% | +2.8% | +10.1% | +2.7% |
| 86 | +2.9% | +3.9% | +2.9% | +10.1% | +2.7% |
| 87 | +2.9% | +4.1% | +2.9% | +10.1% | +2.7% |
| 88 | +2.8% | +2% | +5.2% | +10.1% | +2.7% |
| 89 | No change | +4.2% | +4.5% | +2.3% | +2.7% |
| 90 | No change | +4.2% | +4.5% | +2.3% | +2.7% |
| 91 | No change | +4.9% | No change | +2.3% | +2.7% |
| 92 | No change | +5% | No change | +2.3% | +3.4% |
| 93 | No change | +5% | +3.3% | +2.3% | +3.4% |
| 94 | No change | +5% | No change | +2.3% | +3.4% |
| 95 | +4.8% | +4.8% | No change | +2.3% | +3.4% |
| 96 | +19% | No change | No change | +2.3% | +3.4% |
| 97 | +4.8% | No change | No change | +4.9% | +3.4% |
| 98 | No change | No change | No change | +5.2% | +3.4% |
| 99 | +12.1% | No change | +2.9% | +1.8% | +3.4% |
| 100 | No change | +4.6% | +0.9% | +4.9% | +3.4% |
| 101 | No change | +2% | No change | +5.1% | +3.4% |
| 102 | No change | +3.9% | +8.3% | +5.1% | +3.4% |
| 103 | No change | +7.9% | No change | +5.1% | +3.4% |
| 104 | No change | No change | No change | +4.9% | +3.4% |
| 105 | No change | No change | +0.9% | +5% | +3.4% |
| 106 | No change | +2.8% | +2.9% | +4.9% | +3.4% |
| 107 | No change | +4.9% | +2.5% | +5.2% | +3.4% |
| 108 | +3.7% | No change | +6.9% | +5% | +3.4% |
| 109 | +3.4% | No change | +6.9% | +2.1% | +3.4% |
| 110 | +8.8% | No change | No change | +2.1% | +3.4% |
| 111 | +3.1% | +5% | +4.5% | +5.1% | +3.4% |
| 112 | +3.1% | +5% | +3.2% | +2.1% | +3.4% |
| 113 | No change | +5% | +3.3% | +2.1% | +3.4% |
| 114 | No change | +2.8% | +2.9% | +5% | +3.4% |
| 115 | No change | +2.8% | +2.9% | +2.2% | +3.4% |
| 116 | +4.7% | +6.7% | +6.5% | +2.7% | +3.3% |
| 117 | No change | No change | No change | +3.3% | +3.3% |
| 118 | +4.7% | +6.7% | +6.5% | +3.3% | +3.3% |
Why it mattersInterpretation
The published averages are not what a sector experienced
Every one of the five group averages is taken across all 118 sectors, including the sectors that did not move. For Use Group B2 that means 48 zeros are inside a 3.4% average, and the 70 sectors that did move rose by 5.7% on average. So a developer reading "B2 rose 3.4%" and applying it to a site is using a number that describes the table rather than any parcel. The method is a reconstruction: taking the unweighted mean of the per-sector percentage change across all 118 sectors reproduces all five published figures to the decimal shown, while weighting by rate level does not. The Singapore Land Authority states no method, so an open question in Prevo's research record keeps that as an inference rather than a fact.
The 29% is a band, not an outlier
Sectors 54, 55 and 56 all sat at S$7,700 per sq m of gross floor area in March 2026. Sector 54 went to S$9,940 and the other two to S$9,520. Three adjacent sectors moving off one base in one cycle is a repricing of a band, and reporting sector 54 alone as an anomaly would describe the wrong event. What is not available is the reason: the release names no sector, gives no cause, and publishes none of the valuation evidence.
Four sectors are not the same ground they were
Sector numbers 7, 16, 23 and 35 in the March table and the same numbers in the September table do not describe identical land. The rate comparisons for those sectors are still arithmetically correct, because they compare what was published against each number, but they cannot support a conclusion about a parcel that crossed an adjusted boundary. Sector 23 and sector 35 both carry above-average moves, and neither can be separated from the boundary change without the maps. This archive does not hold them.
The date that decides a case is the grant
A proposal granted Provisional Permission on 31 August 2026 is on the March table. The same proposal granted on 1 September is on the September one. The Liability Order can issue months later and does not move the case. For an industrial proposal in sector 73 that difference is S$2,359 against S$2,597 per sq m of gross floor area, decided by which side of one date a decision by the Urban Redevelopment Authority happened to fall.
Market context
The market around the announcement
When this was announced on 31 August 2026, URA's latest quarterly figures were for 2Q2026, published 24 July 2026, 38 days earlier.
No release since the announcement is in the archive yet. Figures will appear here as releases are added.
| Private residential | 4Q2025Jan 2026 | 1Q2026Apr 2026 | On the day2Q2026Jul 2026 | Trend |
|---|---|---|---|---|
| Prices | ||||
| Private home price index | 216.4 | 218.3 | 219.4 | |
| Non-landed, core central region | 157.7 | 158.6 | 161.5 | |
| Private rental index | 160.9 | 161.4 | 162.5 | |
| Sales | ||||
| New homes sold by developers | 2,940 | 2,013 | 2,141 | |
| Resales | 3,529 | 3,225 | 3,813 | |
| Sub-sales | 230 | 175 | 194 | |
| Units launched | 2,632 | 1,844 | 1,783 | |
| Supply | ||||
| Unsold, uncompleted, with planning approval | 14,859 | 16,095 | 14,929 | |
| Pipeline with planning approval | 35,690 | 38,133 | 38,556 | |
| Vacancy rate | 6.0% | 6.2% | 6.4% | |
Each figure is the quarter's own value as URA printed it in that quarter's release, not as later revised. Select a figure to see the annex and page it comes from.
Held back: URA prints the number in more than one place and the table's labels do not settle which one it is, so the archive stores it but does not show it.
What happens next
The half-yearly revision effective 1 March 2027
Direction of the published residential averages at the March 2027 revision
Show detail
Direction of the published residential averages at the March 2027 revision
Interpretation
The published average increase for landed residential slowed from 4% at the March 2026 revision to 3.5% here, and for non-landed residential from 4.1% to 3.4%. Two observations are not a trend, and the deceleration is small enough that a single cycle can reverse it. The test is worth pre-registering anyway, because it is the only forward question this event supports that is answered by a document the Singapore Land Authority reliably publishes on a known cadence. Any reading of it inherits the reconstruction problem noted in Prevo's research record: the averaging method is inferred rather than stated, so a comparison across cycles assumes the method did not change.
Why this grade
No grade is assigned. This records the direction of a published figure across two revisions, not a market response to anything, and the rates are set by reference to land values, so the figure moves with the market rather than against it.
The revisions effective 1 March 2027 and 1 September 2027
Whether the sector 54, 55 and 56 non-landed residential repricing is sustained
Show detail
Whether the sector 54, 55 and 56 non-landed residential repricing is sustained
Interpretation
The three sectors shared one March 2026 rate of S$7,700 per sq m of gross floor area and all three received unusually large increases in the same cycle, which is the signature of a band being repriced rather than of three separate assessments. The reason is unavailable: nothing held names the valuation evidence or the transactions the Chief Valuer considered. A later reversal would show the September 2026 levels were not maintained; it would not establish why either move happened.
Why this grade
No grade is assigned. The observation is whether a published rate holds, and the archive holds nothing that would attribute either the rise or a reversal.
August and September 2026
Concentration of Provisional Permission grants before the effective date
Show detail
Concentration of Provisional Permission grants before the effective date
Interpretation
An observation the one-day window already disqualifies as a causal test. Rising rates give an applicant an economic preference for an earlier grant, but the trigger is a grant by the Urban Redevelopment Authority rather than an act of the applicant, and the revision was published on 31 August for a 1 September effective date, so nobody could act on the announcement inside the window. Any clustering found in August 2026 would therefore belong to the half-yearly cadence, which is public and predictable, rather than to this announcement. Record the numbers if they become available and attribute nothing to them. Publicly available Urban Redevelopment Authority statistics may in any case not be granular enough to separate relevant grants from the rest.
Why this grade
No grade is assigned, and none is available. The announcement preceded the effective date by one day and the trigger is outside the applicant's control, so no observed concentration could be attributed to this event.
Conditional on Urban Redevelopment Authority grant data being published at sufficient granularity, which it may never be.
From 1 September 2026, as Liability Orders issue for sites near the adjusted boundaries
Whether the boundary adjustments change the sector a parcel is assessed in
Show detail
Whether the boundary adjustments change the sector a parcel is assessed in
Interpretation
A boundary change moves a parcel between sectors, which changes the applicable rate independently of any rate movement, so a site can face a different charge in September 2026 without its own sector rate having moved at all. The archive cannot test this yet: the September 2026 sector maps are not held, the March 2026 maps have not been set against them, and Liability Orders are not published. An open question in Prevo's research record is the precondition. Until it closes, the qualification on claim 15 is the only guard the published page carries.
Why this grade
No grade is assigned. This asks whether a redrawn boundary moved a parcel, which is a question about a map rather than about a market response.
Neither September 2026 sector map is held, and Liability Orders are not public.
What Prevo thinks
Prevo view
InterpretationThis is a routine revision whose value to a reader lies almost entirely in the three qualifications around it. The headline figures are safe to repeat and useless to apply: none of the five averages describes a sector, and the one most likely to be quoted, 3.4% for non-landed residential, is 5.7% among the sectors that actually moved. The sector 54 to 56 move is the item worth a practitioner's attention, because a band repriced by 24% to 29% in one cycle changes a residual land valuation in a way a group average never signals. And the boundary adjustments quietly break the one assumption everybody makes when comparing two tables, which is that a sector number means the same thing in both. The archive publishes this event with the rate arithmetic confirmed and that last assumption explicitly unconfirmed for four sectors.
Confidence: MEDIUM-HIGH
What would change this view: The September 2026 sector maps, set against the maps in force for March 2026, would settle whether the boundary adjustments moved any parcel and would allow the above-average movements in sectors 23 and 35 to be read as rate changes rather than as possible boundary artefacts. A statement from the Singapore Land Authority on how the group averages are computed would turn the reconstruction into a fact and make a cross-cycle series defensible. Retrieving the subsidiary legislation in force from 1 September 2026 would let the archive cite the operative law rather than the press release, and would settle whether the prescribed table and the published table agree.
Verify
The full research record: every claim, source, assumption, uncertainty and correction, collapsed until you open it.
Sources and verification
The case for and the case against2
The case for
The revision is what the regime is designed to do. Rates that track land values keep the charge proportionate to the uplift being taxed, and the Singapore Land Authority states the review was conducted with the Chief Valuer on the published half-yearly cadence. Nothing in the table looks arbitrary against that purpose: four use groups did not move at all, Use Group E moved as three blocks by roughly the same percentage everywhere, and the industrial column moved in every sector within a narrow band. The one instrument the release explains is the one where the explanation is most needed, since places of worship and civic and community institutions have no market transaction to read a rate off.
The case against
The publication tells a reader almost nothing about how the numbers were reached. Five averages are stated with no method, and the method that reproduces them had to be inferred here from two tables. Three sectors were repriced by 20% or more with no sector named and no reason given. Four boundaries were redrawn and described as minor, with no measure of the land moved and the maps published as separate documents a reader has to go and find. None of that is a defect in the rates, and all of it means a developer cannot check the figure that decides the charge against anything except the table itself.
Assumptions behind this analysis3
- The September 2026 and March 2026 tables were read correctly, which the cell by cell agreement between the press release and the standalone Annex A across all 1,062 cells supports.
- The published group averages are unweighted means of the per-sector percentage change across all 118 sectors, which reproduces every one of the five figures and is an inference rather than a stated method.
- Sector numbers other than 7, 16, 23 and 35 describe the same ground in both tables, which the release implies by naming only four adjustments.
What remains uncertain6
- What the boundary adjustments to sectors 7, 16, 23 and 35 actually moved, and whether any parcel changed sector
- How the Singapore Land Authority computes the published use group averages
- Why the non-landed residential rate in sectors 54, 55 and 56 was repriced, and what valuation evidence supported it
- What happens to a first extension to a Provisional Permission granted on or after 1 September 2026
- The subsidiary legislation applicable from 1 September 2026, and whether the legally prescribed table matches the table published by the Singapore Land Authority
- What the dash in the Use Group G column means in sectors 1 to 95
Full event recordDates, regulator, scope, every stored claim value, the position before and the current status
Event facts
- Announced
- 31 August 2026
- Effective
- 1 September 2026
- Announcement to effective
- 1 day
- Regulator
- Singapore Land Authority, Urban Redevelopment Authority
- Instruments and scope
- Land in Singapore on which Land Betterment Charge is assessed by the Table of Rates method, where the chargeable consent is a Provisional Permission granted on or after 1 September 2026, or a second or subsequent extension to a Provisional Permission granted on or after that date. The table covers 118 geographical sectors and nine use groups, with Use Groups A to E stated per sq m of gross floor area and Use Groups F to H per sq m of land area. Cases assessed under the Valuation method rather than the Table of Rates method sit outside the table.
- Claim 3
- 1.7%[Singapore Land Authority press release, 31 August 2026, paragraph 3]
- Claim 5
- 3.5%An unweighted average including ten sectors that did not move. No single sector rose by 3.5%.[Singapore Land Authority press release, 31 August 2026, paragraph 4]
- Claim 7
- 3.4%An average including 48 sectors that did not move. Sector outcomes run from no change to 29%.[Singapore Land Authority press release, 31 August 2026, paragraph 5]
- Claim 10
- 3.9%The largest average, not the largest single move. Sector 54 in Use Group B2 rose 29.09%.[Singapore Land Authority press release, 31 August 2026, paragraphs 7 and 8]
- Claim 12
- 2.9%[Singapore Land Authority press release, 31 August 2026, paragraph 8]
- Claim 14
- 118 geographical sectors[Singapore Land Authority press release, 31 August 2026, paragraph 9, first sentence, with Appendix 2 of that release compared against Appendix 2 of the 27 February 2026 release]
- Claim 18
- 9940 S$ per sq m of gross floor areaOne sector of 118, and a tax rate per sq m of gross floor area, not a land price.[Singapore Land Authority press release, 31 August 2026, Appendix 1, sector 54 row, Use Group B2 column; the same row and column in Appendix 1 of the 27 February 2026 release for the March 2026 rate; Annex A, Table for Land Betterment Charge Rates per Square Metre, September 2026, against which all 1,062 cells were checked]
- Claim 19
- 9520 S$ per sq m of gross floor area[Singapore Land Authority press release, 31 August 2026, Appendix 1, sectors 55 and 56 rows, Use Group B2 column; the same rows and column in Appendix 1 of the 27 February 2026 release for the March 2026 rates]
- Claim 20
- 8750 S$ per sq m of gross floor area[Singapore Land Authority press release, 31 August 2026, Appendix 1, sector 96 row, Use Group A column; the same row and column in Appendix 1 of the 27 February 2026 release for the March 2026 rate]
- Claim 21
- 22330 S$ per sq m of gross floor area[Singapore Land Authority press release, 31 August 2026, Appendix 1, sector 67 row, Use Group B1 column; the same row and column in Appendix 1 of the 27 February 2026 release for the March 2026 rate]
- Claim 22
- 18550 S$ per sq m of gross floor area[Singapore Land Authority press release, 31 August 2026, Appendix 1, sector 42 row, Use Group A column; the same row and column in Appendix 1 of the 27 February 2026 release for the March 2026 rate]
- Claim 23
- 15540 S$ per sq m of gross floor area[Singapore Land Authority press release, 31 August 2026, Appendix 1, sector 43 row, Use Group B2 column; the same row and column in Appendix 1 of the 27 February 2026 release for the March 2026 rate]
- Claim 24
- 2898 S$ per sq m of gross floor area[Singapore Land Authority press release, 31 August 2026, Appendix 1, sector 111 row, Use Group D column; the same row and column in Appendix 1 of the 27 February 2026 release for the March 2026 rate]
- Claim 25
- 19110 S$ per sq m of gross floor area[Singapore Land Authority press release, 31 August 2026, Appendix 1, sectors 41 and 42 rows, Use Group C column; the same rows and column in Appendix 1 of the 27 February 2026 release]
- Claim 27
- 34 S$ per sq m of land area[Singapore Land Authority press release, 31 August 2026, Appendix 1, Use Group G column read across all 118 rows, with sector 96 the first row carrying a rate; the same column in Appendix 1 of the 27 February 2026 release]
- Claim 29
- 1 months[Singapore Land Authority Land Betterment Charge page, the introductory explanation immediately before the computation-method paragraphs, retrieved 1 September 2026]
- Before this framework
- The rates in force were those published on 27 February 2026 for the half year from 1 March 2026 to 31 August 2026, across the same 118 geographical sectors and the same nine use groups. In that table the non-landed residential rate in sectors 54, 55 and 56 stood at a common S$7,700 per sq m of gross floor area, the landed residential rate in sector 67 was S$20,650, the commercial rate in sector 42 was S$17,850, and Use Group E ran in three contiguous bands at S$1,022, S$812 and S$427. The March 2026 release recorded no change to the Use Groups Table and no change to the geographical sectors.
- Positioning at introduction
- The Singapore Land Authority states that the rates were revised following a review conducted in consultation with the Chief Valuer. The release gives a reason for one use group only: rates for places of worship and civic and community institutions rose to keep pace with the overall growth in land values. It offers no reason for the movements in the other four use groups, and publishes neither the valuation evidence, nor the transactions considered, nor the method by which sector rates or the published averages were derived.
- Current status
- Active as introduced, no amendment recorded in this archive.
Evidence behind this event
29 claims, 29 verified
- Causally established outcomes
- 0
- Interpretive sections, not claim-verifiableWhy it matters, Prevo View, The case for, The case against
- 4
Policy facts verified29
Claim 1, Claim 2, Claim 3, Claim 4, Claim 5, Claim 6, Claim 7, Claim 8, Claim 9, Claim 10, Claim 11, Claim 12, Claim 13, Claim 14, Claim 15, Claim 16, Claim 17, Claim 18, Claim 19, Claim 20, Claim 21, Claim 22, Claim 23, Claim 24, Claim 25, Claim 26, Claim 27, Claim 28, Claim 29
Every claim, by type
Rates, figures and counts19
- Claim 3
The rates for Use Group A, commercial, increased by 1.7% on average.
VERIFIED PRIMARY[Singapore Land Authority press release, 31 August 2026, paragraph 3]An average across all 118 sectors, including the 72 that did not move. No individual sector rose by 1.7%, so this is not the increase any commercial site will see. Across the 46 sectors that did move, the mean increase reconstructed from the two published tables is 4.3%. The figure is a rate of change and not a level, so no before-value is stored. The Singapore Land Authority does not state how it computes the published averages; the unweighted mean across all 118 sectors reproduces all five of them and that the method remains a reconstruction.
- Claim 4
For Use Group A, 46 of the 118 sectors saw an increase of about 3% to 19%, and the remaining 72 sectors saw no change.
VERIFIED PRIMARY[Singapore Land Authority press release, 31 August 2026, paragraph 3]The lower endpoint is approximate and the release says so. Reconstructed from the two published tables, the smallest increase is 2.52% in sector 71, and eighteen of the 46 moving sectors rose by less than 3%. The stated upper endpoint of about 19% corresponds to sector 96, where the reconstructed rise is 19.05% and which is carried at claim 20. No sector decreased. The stored range is the range the release states; the sector counts are in the claim text and are not stored in a value column, because one claim cannot hold a count and two endpoints at once.
- Claim 5
The rates for Use Group B1, residential landed, increased by 3.5% on average.
VERIFIED PRIMARY[Singapore Land Authority press release, 31 August 2026, paragraph 4]An average across all 118 sectors, including the 10 that did not move, and a rate of change rather than a level, so no before-value is stored. This is not a land price index and not a forecast of landed values. It is the Chief Valuer's assessment applied to a tax table, and it moves in discrete steps at six-month intervals. The comparable figure at the March 2026 revision was 4%.
- Claim 6
For Use Group B1, 108 of the 118 sectors saw an increase of about 2% to 8%, and the remaining 10 sectors saw no change.
VERIFIED PRIMARY[Singapore Land Authority press release, 31 August 2026, paragraph 4]Reconstructed from the two published tables, the range runs from 1.82% in sector 34 to 8.14% in sector 67, which is carried at claim 21. The ten sectors that did not move are 96, 97, 98, 99, 104, 105, 108, 109, 110 and 117. Outside Use Groups D and E, where every sector moved, this is the widest participation in the revision.
- Claim 7
The rates for Use Group B2, residential non-landed, increased by 3.4% on average.
VERIFIED PRIMARY[Singapore Land Authority press release, 31 August 2026, paragraph 5]An average across all 118 sectors, including the 48 that did not move, and a rate of change rather than a level, so no before-value is stored. Across the 70 sectors that did move the mean increase reconstructed from the two published tables is 5.7%. A collective sale or redevelopment budget cannot be adjusted by 3.4% on the strength of this number: the sector rate is what the charge is assessed on, and sector outcomes in this revision run from no change at all to 29%. The comparable figure at the March 2026 revision was 4.1%.
- Claim 8
For Use Group B2, 70 of the 118 sectors saw an increase of about 1% to 29%, and the remaining 48 sectors saw no change.
VERIFIED PRIMARY[Singapore Land Authority press release, 31 August 2026, paragraph 5]The 29% describes one sector and not a market. Reconstructed from the two published tables, the range runs from 0.93% in sector 100 to 29.09% in sector 54. Only three sectors rose by 20% or more, and they are 54, 55 and 56, which shared one March 2026 rate and are carried at claims 18 and 19. This is the widest dispersion of any use group in the revision, and 48 sectors did not move at all.
- Claim 10
The rates for Use Group D, industrial, increased by 3.9% on average, and every sector rose.
VERIFIED PRIMARY[Singapore Land Authority press release, 31 August 2026, paragraphs 7 and 8]The largest average increase of any use group in this revision, and a rate of change rather than a level, so no before-value is stored. The largest average is not the largest single move, which sits in Use Group B2 at sector 54 and is carried at claim 18. That every sector rose is carried by the sentence quoted at claim 11, in the same paragraph.
- Claim 11
For Use Group D, all 118 sectors saw increments of about 2% to 10%.
VERIFIED PRIMARY[Singapore Land Authority press release, 31 August 2026, paragraph 7]Reconstructed from the two published tables, the range runs from 1.84% in sector 99 to 10.09%, the upper figure shared by fifteen sectors that all moved from S$2,359 to S$2,597 per sq m of gross floor area. Use Groups D and E are the only two in which every sector moved. The sector count is in the claim text and the stored range is the range the release states.
- Claim 12
The rates for Use Group E, covering places of worship and civic and community institutions, increased by 2.9% on average across all sectors, which the release attributes to keeping pace with the overall growth in land values.
VERIFIED PRIMARY[Singapore Land Authority press release, 31 August 2026, paragraph 8]The only use group for which the release gives a reason, and the reason is not extended to any other group anywhere in the text. That reason does not make Use Group E a proxy for land values generally: its rates take three distinct values across the whole island, as carried at claim 26, so the column holds far less sector detail than the others. Every sector moved, within a narrow spread of 2.74% to 3.45%.
- Claim 18
In sector 54, the Use Group B2 rate rose from S$7,700 to S$9,940 per square metre of gross floor area, the largest single-sector increase in this revision.
VERIFIED PRIMARY[Singapore Land Authority press release, 31 August 2026, Appendix 1, sector 54 row, Use Group B2 column; the same row and column in Appendix 1 of the 27 February 2026 release for the March 2026 rate; Annex A, Table for Land Betterment Charge Rates per Square Metre, September 2026, against which all 1,062 cells were checked]Sector 54 is not an isolated outlier, and reporting it as one misdescribes what happened. Sectors 55 and 56 sat at the same S$7,700 in March 2026 and both rose to S$9,520, so three adjacent sectors were repriced off a common base rather than one sector moving alone; claim 19 carries the other two. The increase reconstructs to 29.09%, which is the upper endpoint the release states as about 29%. The rate applies to non-landed residential development in that sector only, and it is a tax rate per sq m of gross floor area rather than a land price.
- Claim 19
In sectors 55 and 56, the Use Group B2 rate rose from S$7,700 to S$9,520 per square metre of gross floor area, from the same March 2026 base as sector 54.
VERIFIED PRIMARY[Singapore Land Authority press release, 31 August 2026, Appendix 1, sectors 55 and 56 rows, Use Group B2 column; the same rows and column in Appendix 1 of the 27 February 2026 release for the March 2026 rates]The increase reconstructs to 23.64% in both sectors. With sector 54 these are the only three sectors in any use group that rose by 20% or more in this revision. The release identifies none of the three by number and states no reason for the move, and nothing held names the valuation evidence the Chief Valuer considered.
- Claim 20
In sector 96, the Use Group A rate rose from S$7,350 to S$8,750 per square metre of gross floor area, the largest commercial increase in this revision.
VERIFIED PRIMARY[Singapore Land Authority press release, 31 August 2026, Appendix 1, sector 96 row, Use Group A column; the same row and column in Appendix 1 of the 27 February 2026 release for the March 2026 rate]The increase reconstructs to 19.05%, matching the upper endpoint the release states as about 19% and carried at claim 4. Sector 96 is also one of the ten sectors in which the Use Group B1 rate did not move, so a sector can sit at the top of one use group and be static in another. The release does not identify the sector; the ranking is read across all 118 rows of the column.
- Claim 21
In sector 67, the Use Group B1 rate rose from S$20,650 to S$22,330 per square metre of gross floor area, which is both the largest landed residential increase and the highest landed residential rate in the table.
VERIFIED PRIMARY[Singapore Land Authority press release, 31 August 2026, Appendix 1, sector 67 row, Use Group B1 column; the same row and column in Appendix 1 of the 27 February 2026 release for the March 2026 rate]The increase reconstructs to 8.14%, matching the upper endpoint the release states as about 8% and carried at claim 6. The ranking stated here is within use group b1 only, and that is narrower than the source packet asserted. The packet placed this rate below Use Group C at sectors 41 and 42, and separately recorded that rate as S$19,110, which is lower than S$22,330; the two statements cannot both hold. Only the six table rows transcribed into the packet are held here, so no cross-group maximum is asserted in either direction. The release states no ranking of any kind.
- Claim 22
In sector 42, the Use Group A rate rose from S$17,850 to S$18,550 per square metre of gross floor area, the highest commercial rate in the table.
VERIFIED PRIMARY[Singapore Land Authority press release, 31 August 2026, Appendix 1, sector 42 row, Use Group A column; the same row and column in Appendix 1 of the 27 February 2026 release for the March 2026 rate]Highest within Use Group A only. Nothing in the release identifies it as the highest; the ranking is read across all 118 rows of the column and is the archive's reading rather than a statement by the Singapore Land Authority. The increase reconstructs to 3.92%, so the highest commercial rate is not among the largest commercial movements.
- Claim 23
In sector 43, the Use Group B2 rate rose from S$14,700 to S$15,540 per square metre of gross floor area, the highest non-landed residential rate in the table.
VERIFIED PRIMARY[Singapore Land Authority press release, 31 August 2026, Appendix 1, sector 43 row, Use Group B2 column; the same row and column in Appendix 1 of the 27 February 2026 release for the March 2026 rate]Highest within Use Group B2 only, and read across the table rather than stated in the release. The increase reconstructs to 5.71%, against a headline group average of 3.4%, so the most expensive non-landed sector moved at roughly the rate of the sectors that moved rather than at the rate of the table.
- Claim 24
In sector 111, the Use Group D rate rose from S$2,758 to S$2,898 per square metre of gross floor area, the highest industrial rate in the table.
VERIFIED PRIMARY[Singapore Land Authority press release, 31 August 2026, Appendix 1, sector 111 row, Use Group D column; the same row and column in Appendix 1 of the 27 February 2026 release for the March 2026 rate]Highest within Use Group D only, and read across the table rather than stated in the release. Industrial rates sit far below commercial and residential rates throughout the table: in sector 111 itself the commercial rate is S$11,550, four times the industrial one, and in sector 41 it is S$17,850 against an industrial S$917. The increase reconstructs to 5.08%.
- Claim 25
In sectors 41 and 42, the Use Group C rate stayed at S$19,110 per square metre of gross floor area, the highest rate recorded in Use Group C.
VERIFIED PRIMARY[Singapore Land Authority press release, 31 August 2026, Appendix 1, sectors 41 and 42 rows, Use Group C column; the same rows and column in Appendix 1 of the 27 February 2026 release]A level that did not move, so no change pair is stored. Writing a before-value and an after-value that are the same number would present a static rate as a revision. The source packet called this the highest rate anywhere in the table and that is not carried, because the same packet records S$22,330 in Use Group B1 at sector 67, which is higher. Only six table rows are transcribed into the packet, so this archive can rank within Use Group C and no further. The release states no ranking of any kind.
- Claim 26
Use Group E takes only three distinct values across the whole table, at S$1,050 per square metre in sectors 1 to 91, S$840 in sectors 92 to 115 and S$441 in sectors 116 to 118, each band contiguous.
VERIFIED PRIMARY[Singapore Land Authority press release, 31 August 2026, Appendix 1, Use Group E column read across all 118 rows, with sector 92 the first row of the middle band; the same column in Appendix 1 of the 27 February 2026 release for the March 2026 values]The banding is read off the table and is not stated in the release. The same three-band structure with the same boundaries is present in the March 2026 table, where the values were S$1,022, S$812 and S$427, so each band moved as a block. That is why the spread of Use Group E movements is only 2.74% to 3.45% while every sector moved. The stored range is the top and bottom of the column; the middle band value is in the claim text.
- Claim 27
The Use Group G column shows a dash in sectors 1 to 95 and a rate of S$34 per square metre of land area in sectors 96 to 118, unchanged from March 2026.
VERIFIED PRIMARY[Singapore Land Authority press release, 31 August 2026, Appendix 1, Use Group G column read across all 118 rows, with sector 96 the first row carrying a rate; the same column in Appendix 1 of the 27 February 2026 release]A dash should not be read as a rate of zero. The release does not say what it means. It may record that no rate is published for those sectors, or that the use group is not applicable there, and nothing held decides between the two readings. Nothing in the release supports treating an unpublished cell as a nil charge. Only the S$34 is stored, because a value column would misrepresent the dash as a number.
Policy decisions and design4
- Claim 1
The Land Betterment Charge rates for the period from 1 September 2026 to 28 February 2027 were revised following a review by the Singapore Land Authority conducted in consultation with the Chief Valuer.
VERIFIED PRIMARY[Singapore Land Authority press release, 31 August 2026, paragraph 1]This states that a review took place and who conducted it, and nothing about what the review found. The release does not set out the valuation evidence, the transactions considered, or the method by which sector rates or the published averages were derived. The only figures in the claim are the two calendar dates bounding the rate period, and the start of that period is stored as the event effective date.
- Claim 2
Rates increased for Use Groups A, B1, B2, D and E, and remained unchanged for Use Groups C, F, G and H.
VERIFIED PRIMARY[Singapore Land Authority press release, 31 August 2026, paragraph 2]Increased on average is not increased everywhere. For Use Groups A, B1 and B2 the word describes the average across sectors, and a majority or a substantial minority of sectors did not move at all: 72 of the 118 sectors were unchanged in Use Group A and 48 in Use Group B2. Only in Use Groups D and E did every sector move. Reading this as every commercial and residential sector rising is the available error, and it is wrong for 120 sector cells. The digits in the claim are parts of the use group names B1 and B2, not measurements; the size of each increase is carried at claims 3, 5, 7, 10 and 12.
- Claim 9
The rates for Use Group C, covering hotel and hospital uses, remain unchanged.
VERIFIED PRIMARY[Singapore Land Authority press release, 31 August 2026, paragraph 6, with the September 2026 and March 2026 Appendix 1 tables compared cell by cell]Confirmed against the tables: all 118 Use Group C cells are identical in the two releases. A wording difference between the two releases is not a narrowing of the use group. The March 2026 release heads the equivalent paragraph "Hotel, Hospital and Nursing homes" where the September 2026 release heads it "Hotel, Hospital". Appendix 2 describes Use Group C identically in both, as hospital, hotel room and hotel-related uses, and the September release states that the Use Groups Table did not change. Reading the shorter heading as the removal of nursing homes would be wrong on the face of an appendix that did not move.
- Claim 13
The rates for Use Groups F, G and H remain unchanged.
VERIFIED PRIMARY[Singapore Land Authority press release, 31 August 2026, paragraph 2, with the September 2026 and March 2026 Appendix 1 tables compared cell by cell]Confirmed against the tables. Use Group F stands at S$10 per sq m of land area in every sector and Use Group H at S$1, both unchanged. Use Group G is the column that holds two kinds of entry and is carried separately at claim 27. Together with Use Group C, four of the nine use groups did not move anywhere on the island.
Rules and scope4
- Claim 14
There are no changes to the Use Groups Table, and the number of geographical sectors remains 118.
VERIFIED PRIMARY[Singapore Land Authority press release, 31 August 2026, paragraph 9, first sentence, with Appendix 2 of that release compared against Appendix 2 of the 27 February 2026 release]The number of sectors being unchanged is not the sectors being unchanged, and the same paragraph records boundary adjustments to four of them, carried at claim 15. The Use Groups Table half of the claim rests on comparing Appendix 2 in the two releases, which read identically. The standalone Annex F published alongside the September 2026 release was not read, records that.
- Claim 15
Boundary adjustments described as minor were made to geographical sectors 7, 16, 23 and 35, to align with the land parcel zoning demarcations in the Urban Redevelopment Authority's Master Plan 2025.
VERIFIED PRIMARY[Singapore Land Authority press release, 31 August 2026, paragraph 9, second sentence]For these four sectors a sector number in the March table and the same number in the September table do not describe identical ground. The release gives no measure of the land moved and no detail of where the boundaries went. Minor is the Singapore Land Authority's characterisation and is not checkable from anything held: that requires the September 2026 sector maps, which this archive does not hold, set against the maps in force for March 2026. The rate comparisons remain arithmetically correct, because they compare the rates published against each sector number, but they establish nothing about a parcel that crossed an adjusted boundary. Sector 23 rose 5.56% in Use Group A and 5.95% in Use Group B2, and sector 35 rose 6.13% in Use Group B2, all above their group averages, and none of those movements can be separated from the boundary change on anything held. The digits in the claim are sector identifiers and the name of a Master Plan, so no value column applies.
- Claim 17
Rates for Use Groups A to E are stated per square metre of gross floor area, and rates for Use Groups F to H per square metre of land area.
VERIFIED PRIMARY[Singapore Land Authority press release, 31 August 2026, the note beneath the Appendix 1 table]This states the denominator and not the calculation. Multiplying a sector rate by a project's gross floor area does not give the Land Betterment Charge. The charge follows from the difference between the post-chargeable and pre-chargeable valuations, so only the uplift is charged, and the release does not state how chargeable floor area is measured.
- Claim 29
After a planning application or plan lodgment has been submitted to the Urban Redevelopment Authority, the landowner makes no separate application to the Singapore Land Authority for payment of Land Betterment Charge. Where the proposed development results in an increase in land value, the Singapore Land Authority issues a Liability Order stating the amount payable, and payment falls due within one month from the date of that order.
VERIFIED PRIMARY[Singapore Land Authority Land Betterment Charge page, the introductory explanation immediately before the computation-method paragraphs, retrieved 1 September 2026]The standing administrative process, which this revision did not alter, and it is carried because it is what decides when a rate change is felt. It does not mean that no applications exist anywhere in the regime: separate forms cover election of the Valuation method, assumption of liability, deferment and transfer of deferred liability. The one month runs from the date of the Liability Order and not from the grant that triggered the charge.
Dates1
- Claim 16
The revised rates take effect from 1 September 2026 and apply to cases granted Provisional Permission, or a second or subsequent extension to a Provisional Permission, on or after that date.
VERIFIED PRIMARY[Singapore Land Authority press release, 31 August 2026, paragraph 10]A first extension is not named in the trigger. The release names Provisional Permission and second and subsequent extensions, says nothing about a first extension granted on or after the effective date, and this event does not resolve it. New rates from 1 September 2026 reads as though every case assessed after that date is caught, and that is the available error: a case granted Provisional Permission in August 2026 stays on the March 2026 table even where its Liability Order issues much later. A later qualifying extension can create a new applicable trigger, so a grant before the effective date does not put a case beyond every future table.
Background1
- Claim 28
The Land Betterment Charge is a tax on the increase in the value of land arising from a chargeable consent, and it replaced Differential Premium, Development Charge and Temporary Development Levy with effect from 1 August 2022.
VERIFIED PRIMARY[Singapore Land Authority Land Betterment Charge page, opening paragraph of the page body, retrieved 1 September 2026]Background to the regime, which this revision did not change. It is carried so that a reader arriving from an earlier Development Charge table understands why the series changes name in 2022. Differential Premium and Development Charge were administered by the Singapore Land Authority and the Urban Redevelopment Authority respectively before that date.
How this is scored
Counts are by provenance, meaning who established the claim, not by how confident we are. A policy fact is one the regulator's own document states. A market observation comes from a named data series. A derived calculation is one we computed, with the working recorded on the claim.
Interpretations are counted, never netted out. This page will not display zero unsupported claims while interpretive sections sit outside the claim ledger, because that number would be true only by excluding the material most likely to be wrong.
A claim of one type is only treated as verified by a source of the matching type. A market observation is not verified by a regulator press release.
Claims are grouped by the type recorded on each one. Grouping hides nothing: every claim is in exactly one group, in full.
Sources
4 documents
Primary sources4
- Revision of Land Betterment Charge rates from 1 March 2026
Singapore Land Authority · Published 27 February 2026
Cited by 13 claims, 13 verified
- Claim 9 · Singapore Land Authority press release, 31 August 2026, paragraph 6, with the September 2026 and March 2026 Appendix 1 tables compared cell by cell
- Claim 13 · Singapore Land Authority press release, 31 August 2026, paragraph 2, with the September 2026 and March 2026 Appendix 1 tables compared cell by cell
- Claim 14 · Singapore Land Authority press release, 31 August 2026, paragraph 9, first sentence, with Appendix 2 of that release compared against Appendix 2 of the 27 February 2026 release
- Claim 18 · Singapore Land Authority press release, 31 August 2026, Appendix 1, sector 54 row, Use Group B2 column; the same row and column in Appendix 1 of the 27 February 2026 release for the March 2026 rate; Annex A, Table for Land Betterment Charge Rates per Square Metre, September 2026, against which all 1,062 cells were checked
- Claim 19 · Singapore Land Authority press release, 31 August 2026, Appendix 1, sectors 55 and 56 rows, Use Group B2 column; the same rows and column in Appendix 1 of the 27 February 2026 release for the March 2026 rates
- Claim 20 · Singapore Land Authority press release, 31 August 2026, Appendix 1, sector 96 row, Use Group A column; the same row and column in Appendix 1 of the 27 February 2026 release for the March 2026 rate
- Claim 21 · Singapore Land Authority press release, 31 August 2026, Appendix 1, sector 67 row, Use Group B1 column; the same row and column in Appendix 1 of the 27 February 2026 release for the March 2026 rate
- Claim 22 · Singapore Land Authority press release, 31 August 2026, Appendix 1, sector 42 row, Use Group A column; the same row and column in Appendix 1 of the 27 February 2026 release for the March 2026 rate
- Claim 23 · Singapore Land Authority press release, 31 August 2026, Appendix 1, sector 43 row, Use Group B2 column; the same row and column in Appendix 1 of the 27 February 2026 release for the March 2026 rate
- Claim 24 · Singapore Land Authority press release, 31 August 2026, Appendix 1, sector 111 row, Use Group D column; the same row and column in Appendix 1 of the 27 February 2026 release for the March 2026 rate
- Claim 25 · Singapore Land Authority press release, 31 August 2026, Appendix 1, sectors 41 and 42 rows, Use Group C column; the same rows and column in Appendix 1 of the 27 February 2026 release
- Claim 26 · Singapore Land Authority press release, 31 August 2026, Appendix 1, Use Group E column read across all 118 rows, with sector 92 the first row of the middle band; the same column in Appendix 1 of the 27 February 2026 release for the March 2026 values
- Claim 27 · Singapore Land Authority press release, 31 August 2026, Appendix 1, Use Group G column read across all 118 rows, with sector 96 the first row carrying a rate; the same column in Appendix 1 of the 27 February 2026 release
- Revision of Land Betterment Charge Rates from 1 September 2026
Singapore Land Authority · Published 31 August 2026
Cited by 27 claims, 27 verified
- Claim 1 · Singapore Land Authority press release, 31 August 2026, paragraph 1
- Claim 2 · Singapore Land Authority press release, 31 August 2026, paragraph 2
- Claim 3 · Singapore Land Authority press release, 31 August 2026, paragraph 3
- Claim 4 · Singapore Land Authority press release, 31 August 2026, paragraph 3
- Claim 5 · Singapore Land Authority press release, 31 August 2026, paragraph 4
- Claim 6 · Singapore Land Authority press release, 31 August 2026, paragraph 4
- Claim 7 · Singapore Land Authority press release, 31 August 2026, paragraph 5
- Claim 8 · Singapore Land Authority press release, 31 August 2026, paragraph 5
- Claim 9 · Singapore Land Authority press release, 31 August 2026, paragraph 6, with the September 2026 and March 2026 Appendix 1 tables compared cell by cell
- Claim 10 · Singapore Land Authority press release, 31 August 2026, paragraphs 7 and 8
- Claim 11 · Singapore Land Authority press release, 31 August 2026, paragraph 7
- Claim 12 · Singapore Land Authority press release, 31 August 2026, paragraph 8
- Claim 13 · Singapore Land Authority press release, 31 August 2026, paragraph 2, with the September 2026 and March 2026 Appendix 1 tables compared cell by cell
- Claim 14 · Singapore Land Authority press release, 31 August 2026, paragraph 9, first sentence, with Appendix 2 of that release compared against Appendix 2 of the 27 February 2026 release
- Claim 15 · Singapore Land Authority press release, 31 August 2026, paragraph 9, second sentence
- Claim 16 · Singapore Land Authority press release, 31 August 2026, paragraph 10
- Claim 17 · Singapore Land Authority press release, 31 August 2026, the note beneath the Appendix 1 table
- Claim 18 · Singapore Land Authority press release, 31 August 2026, Appendix 1, sector 54 row, Use Group B2 column; the same row and column in Appendix 1 of the 27 February 2026 release for the March 2026 rate; Annex A, Table for Land Betterment Charge Rates per Square Metre, September 2026, against which all 1,062 cells were checked
- Claim 19 · Singapore Land Authority press release, 31 August 2026, Appendix 1, sectors 55 and 56 rows, Use Group B2 column; the same rows and column in Appendix 1 of the 27 February 2026 release for the March 2026 rates
- Claim 20 · Singapore Land Authority press release, 31 August 2026, Appendix 1, sector 96 row, Use Group A column; the same row and column in Appendix 1 of the 27 February 2026 release for the March 2026 rate
- Claim 21 · Singapore Land Authority press release, 31 August 2026, Appendix 1, sector 67 row, Use Group B1 column; the same row and column in Appendix 1 of the 27 February 2026 release for the March 2026 rate
- Claim 22 · Singapore Land Authority press release, 31 August 2026, Appendix 1, sector 42 row, Use Group A column; the same row and column in Appendix 1 of the 27 February 2026 release for the March 2026 rate
- Claim 23 · Singapore Land Authority press release, 31 August 2026, Appendix 1, sector 43 row, Use Group B2 column; the same row and column in Appendix 1 of the 27 February 2026 release for the March 2026 rate
- Claim 24 · Singapore Land Authority press release, 31 August 2026, Appendix 1, sector 111 row, Use Group D column; the same row and column in Appendix 1 of the 27 February 2026 release for the March 2026 rate
- Claim 25 · Singapore Land Authority press release, 31 August 2026, Appendix 1, sectors 41 and 42 rows, Use Group C column; the same rows and column in Appendix 1 of the 27 February 2026 release
- Claim 26 · Singapore Land Authority press release, 31 August 2026, Appendix 1, Use Group E column read across all 118 rows, with sector 92 the first row of the middle band; the same column in Appendix 1 of the 27 February 2026 release for the March 2026 values
- Claim 27 · Singapore Land Authority press release, 31 August 2026, Appendix 1, Use Group G column read across all 118 rows, with sector 96 the first row carrying a rate; the same column in Appendix 1 of the 27 February 2026 release
- Land Betterment Charge
Singapore Land Authority · Publication date not recorded
Cited by 2 claims, 2 verified
- Claim 28 · Singapore Land Authority Land Betterment Charge page, opening paragraph of the page body, retrieved 1 September 2026
- Claim 29 · Singapore Land Authority Land Betterment Charge page, the introductory explanation immediately before the computation-method paragraphs, retrieved 1 September 2026
- Annex A, Table for Land Betterment Charge Rates per Square Metre, September 2026
Singapore Land Authority · Publication date not recorded
Cited by 1 claim, 1 verified
- Claim 18 · Singapore Land Authority press release, 31 August 2026, Appendix 1, sector 54 row, Use Group B2 column; the same row and column in Appendix 1 of the 27 February 2026 release for the March 2026 rate; Annex A, Table for Land Betterment Charge Rates per Square Metre, September 2026, against which all 1,062 cells were checked
Event checked against its primary sources on 1 September 2026. Each claim keeps its own verification status.
Revision history
v1.1
26 September 2026
- Restored the section headings in Why it matters, which had been stored run into the body text. No word changed.
- Foundation repair of 26 September 2026. No figure, date or causality grade was corrected, so no correction was recorded.
Prevo provides research and informational analysis only. It is not a broker, investment adviser or fiduciary, and nothing on this site constitutes investment, legal, tax or financial advice. Verify independently.